How to Calculate Gross Profit Margin for Your Service Business
Learn how to calculate gross profit margin with our guide for service businesses. Get the formula, real-world examples, and tips to boost your profitability.
Payly Team
January 30, 2026
Ready to figure out your gross profit margin? It's simpler than you might think. The go-to formula is (Total Revenue - Cost of Goods Sold) / Total Revenue.
This little calculation does a big job. It tells you exactly how much profit you’re making on every dollar of revenue before you even think about your overheads like rent or marketing. Think of it as a quick health check for your core business operations.
What is Gross Profit Margin, Really?
Your gross profit margin is more than just a number on a spreadsheet; it’s a direct measure of how efficiently your business turns the services you sell into actual profit. For any freelancer, agency, or consultant, this is where you see the real financial health of your service delivery.
A strong margin means you’ve got enough cash left over after covering all the direct costs of a project. That leftover cash is what pays for everything else: your salary, your office space, your software subscriptions, and hopefully leaves a bit extra to reinvest in growing the business.
Keeping a close watch on this figure is always important, but it’s critical when the economy gets a bit shaky. The latest figures from the Australian Bureau of Statistics (ABS) showed company gross operating profits actually fell by 0.5% in the March 2025 quarter. That tells us rising costs are squeezing businesses everywhere. For service providers, this is a clear signal to get serious about tracking profitability and making sure pricing and costs are truly sustainable.
Key Terms You'll Need for Service Businesses
When you’re selling a service, not a physical product, you have to think about terms like "Revenue" and "Cost of Goods Sold" (COGS) a bit differently. Your revenue isn't just a paid invoice, and your COGS isn't a pile of materials sitting in a warehouse. It’s all about the direct cost of delivering your time and expertise.
Your total revenue is pretty straightforward: it's all the income you bring in from client projects, retainers, and any other billable work.
Your COGS, on the other hand, are the expenses that are directly tied to delivering those services. This could include things like:
- Direct Labour Costs: The wages for your team or payments to subcontractors for the hours they spend working directly on client projects.
- Project-Specific Software: A special tool or software licence you bought just for one particular client's job.
- Third-Party Expenses: Any costs for hiring external help, like a freelance copywriter, or buying stock photos for a specific project.
Getting your head around the difference between direct costs (COGS) and overheads is the most important part of this whole exercise. Here’s a simple test: if the project didn't happen, would this cost disappear? If yes, it’s probably COGS. If you’d still have to pay it, it’s an overhead.
To make this crystal clear, let's break down the main components you'll be working with. This table gives you a quick summary before we jump into the numbers with some real-world examples for Australian service businesses.
Gross Profit Margin Formula Components
| Component | Definition for Service Businesses | Example |
|---|---|---|
| Total Revenue | All income generated from client services, projects, and retainers before any expenses are deducted. | A web design agency invoices $20,000 for a new website build. |
| Cost of Goods Sold (COGS) | The direct costs associated with delivering your services. This primarily includes labour and any project-specific materials or software. | The agency pays its designer $5,000 and a freelance copywriter $1,500 for the project. Total COGS is $6,500. |
| Gross Profit | The profit left after subtracting the direct costs (COGS) from your total revenue. It’s your Revenue minus your COGS. | $20,000 (Revenue) - $6,500 (COGS) = $13,500 Gross Profit. |
| Gross Profit Margin | The percentage of revenue that is left as gross profit. Calculated as (Gross Profit / Total Revenue) x 100. | ($13,500 / $20,000) x 100 = 67.5%. |
With these definitions locked in, you have a solid foundation for calculating your own gross profit margin accurately.
Assembling Your Financial Data for Calculation
Before you can even think about your gross profit margin, you need to get your financial ducks in a row. It’s like a chef preparing their ingredients before they start cooking; getting the numbers right from the start is the only way to get a clean, accurate result. For any Australian service business, this all comes down to two key figures: Total Revenue and your Cost of Goods Sold (COGS).
Nailing these isn't just a box-ticking accounting exercise. It's the absolute foundation for understanding how profitable your core business operations really are.
This visual flow shows the simple journey from gathering your revenue and COGS to calculating your final margin.
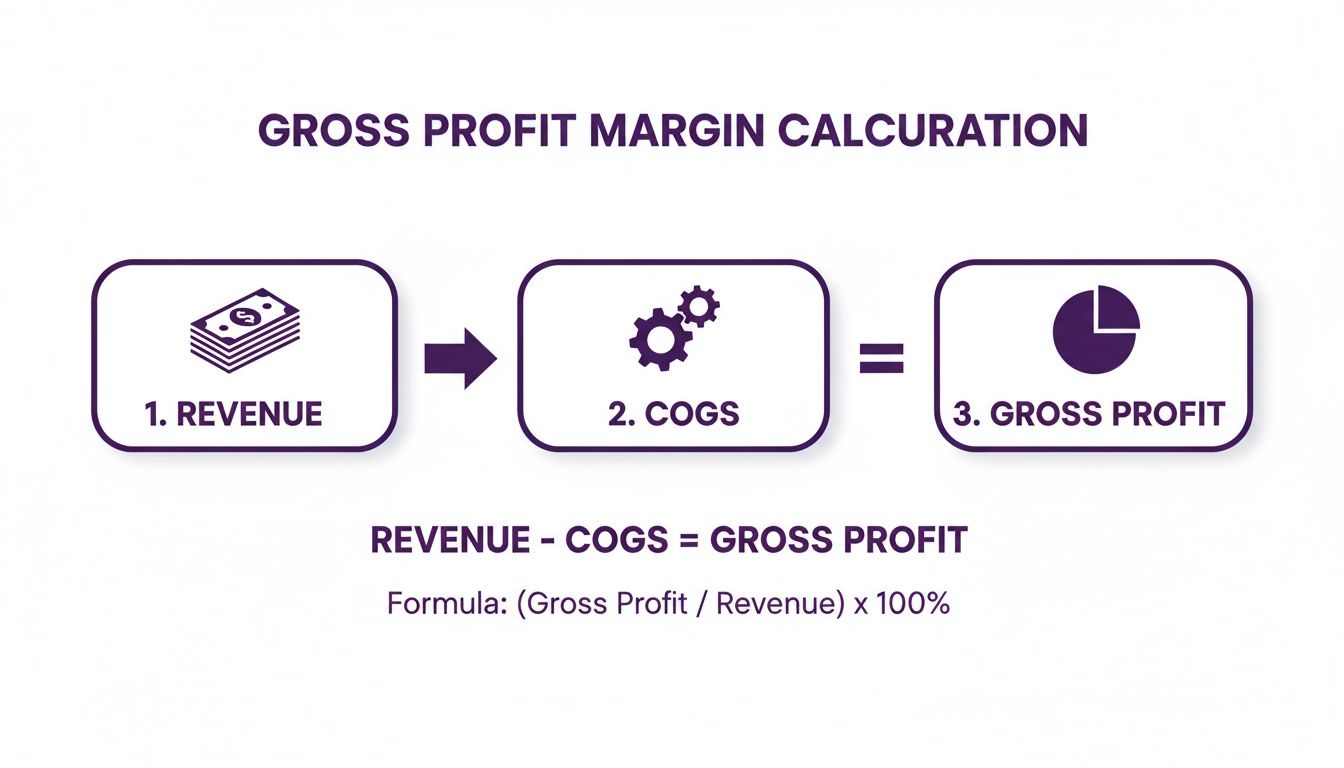
As you can see, it's all about how efficiently your income covers the direct costs of earning it.
Pinpointing Your Total Revenue
For a service business, Total Revenue is simply the total income you’ve earned from your services over a certain period. This isn’t just about the final cheque from a big project; it covers all the ways money comes in.
- Project Fees: The full amount you’ve invoiced for completed projects.
- Retainer Agreements: Those recurring monthly or quarterly fees from your ongoing clients.
- Consulting Fees: Any income from hourly or daily advisory work.
Here’s a crucial detail for Aussie businesses: you must exclude the Goods and Services Tax (GST) from your revenue figure. The GST you collect is just passing through your accounts on its way to the government, so it isn't truly your income. Including it will artificially inflate your revenue and throw your entire calculation off.
Demystifying Cost of Goods Sold for Services
This is where I see a lot of service businesses get tripped up. If you don't sell physical "goods," what is a "cost of goods sold"? For service providers, COGS are the direct costs you incur to deliver your service.
A good rule of thumb is this: if a cost would disappear if you didn't have that specific client or project, it’s probably part of your COGS.
Accurately tracking all your project-related expenses is a critical step. This includes not just labour but also any tools you rely on, like efficient crew schedule software, to get the job done.
For most freelancers, agencies, and consultancies, COGS typically includes:
- Direct Labour Costs: This is usually the biggest one. It’s the portion of salaries or wages paid to your team for the time they spend actively working on client projects.
- Contractor and Freelancer Fees: Money paid to external specialists, like that freelance copywriter or developer you brought in for a specific job.
- Project-Specific Software: The cost of a software licence or subscription you bought exclusively for one client’s needs.
- Third-Party Materials: Expenses like stock photography, premium fonts, or printing services that are billed directly to a project.
Key Takeaway: You have to draw a clear line between COGS and general overheads. Your office rent, marketing budget, and admin salaries are operating expenses, not COGS. They keep the business running but don't directly contribute to delivering a specific service, so they stay out of the gross profit margin calculation.
Getting your direct costs right is especially important in the current economic climate. The Reserve Bank of Australia reports that while most small businesses are still profitable, wages have jumped by 6.3% year-over-year. That makes tracking and managing your direct labour costs more crucial than ever if you want to protect your margins.
With solid revenue and COGS figures in hand, you’ve got the reliable inputs you need. Using dedicated small business accounting software can automate how these figures are categorised, making sure nothing important slips through the cracks.
Putting It Into Practice: Real-World Examples for Service Businesses
The formulas are one thing, but seeing how they play out in the real world is where it all clicks. Let’s walk through a few scenarios for common Australian service businesses to see how gross profit margin is calculated in practice.
We'll cover a solo freelancer, a small agency, and a consulting firm to give you a feel for how different business models handle their numbers.

These examples should help you get a handle on what to count as revenue and COGS for your own business, so you can run the numbers with total confidence.
Example 1: The Freelance Graphic Designer
Meet Chloe, a Melbourne-based freelance designer. She just wrapped up a branding project and invoiced the client $5,000 + GST. To get the job done, she had to pay for a couple of specific assets.
Let's break down the finances for this one project.
- Total Revenue (ex. GST): The total invoice was $5,500, but Chloe knows to exclude the $500 in GST. Her actual revenue for the calculation is $5,000.
- Cost of Goods Sold (COGS):
- A premium font licence purchased specifically for the client’s logo: $150.
- High-resolution stock images for the brand guide: $200.
- Her total COGS comes to $350 ($150 + $200).
Now, we can plug these figures into the formula.
Gross Profit Margin = (Total Revenue - COGS) / Total Revenue
First, we find the gross profit:
$5,000 (Revenue) - $350 (COGS) = $4,650 Gross Profit
Next, we calculate the margin:
$4,650 / $5,000 = 0.93
And finally, turn it into a percentage:
0.93 x 100 = 93% Gross Profit Margin
A 93% margin is fantastic. It shows that Chloe’s direct project costs are incredibly low compared to what she charges. What about her Adobe Creative Cloud subscription? That’s an operating expense, not COGS, because she pays for it every month whether she has this project or not.
Example 2: The Digital Marketing Agency
Next up is PixelPush, a small digital marketing agency in Sydney. They've just finished a three-month campaign for a client, with a total project fee of $30,000 (ex. GST). Their costs are a bit more involved.
Here’s a look at their numbers for the campaign.
- Total Revenue: $30,000
- Cost of Goods Sold (COGS):
- Freelance copywriter for ad content: $4,000.
- SEO contractor for technical work: $6,000.
- Client’s ad spend on Google and Facebook (managed by the agency): $10,000. This is a direct cost because the money was spent exclusively for this campaign.
- Their total COGS adds up to $20,000 ($4,000 + $6,000 + $10,000).
Let’s run the calculation for the agency.
First, the gross profit:
$30,000 (Revenue) - $20,000 (COGS) = $10,000 Gross Profit
Then, the margin percentage:
$10,000 / $30,000 = 0.333
And as a percentage:
0.333 x 100 = 33.3% Gross Profit Margin
This margin is much lower than the freelancer's, but that’s pretty standard for an agency that uses contractors and manages pass-through costs like ad spend. It gives them a clear picture of their profitability before accounting for their own salaries and office rent. Improving sales efficiency can have a big impact here; it's worth seeing how instant estimates can double company sales to understand how small process changes can boost revenue.
Example 3: The Consulting Firm
Finally, let’s look at Strategy Solutions, a consulting firm in Brisbane with a team of salaried employees. They billed $75,000 (ex. GST) for a strategic review project. For them, the main cost is their team’s time.
Here's how they pull their numbers together.
- Total Revenue: $75,000
- Cost of Goods Sold (COGS):
- Two consultants, each on a $100,000 annual salary, which breaks down to about $50 per hour.
- Consultant A logged 200 billable hours on the project.
- Consultant B logged 150 billable hours.
- Total billable time: 350 hours.
- Total Direct Labour Cost: 350 hours x $50/hour = $17,500.
- They also spent $2,500 on travel for client site visits.
- Their total COGS is $20,000 ($17,500 + $2,500).
This example really drives home how crucial it is to track billable time accurately. If you need a hand figuring this out, our guide on https://www.payly.com.au/blog/how-to-calculate-hourly-rate is a great place to start.
Now for the final calculation.
First, the gross profit:
$75,000 (Revenue) - $20,000 (COGS) = $55,000 Gross Profit
Next, the margin:
$55,000 / $75,000 = 0.733
And the final percentage:
0.733 x 100 = 73.3% Gross Profit Margin
This is a healthy margin, telling the firm their pricing is well-aligned with the cost of their main asset: their team. By isolating direct labour costs, they get a sharp, accurate view of how profitable each client engagement really is.
What Is a Good Gross Profit Margin?
So, you’ve crunched the numbers and now you have a percentage staring back at you. But what does that number actually mean? Is 40% good? Bad? Average?
The honest answer is: it depends. A 40% margin might be a reason to pop the champagne in one industry, but a serious red flag in another. There’s no single magic number that defines a “good” gross profit margin. The ideal figure is tied directly to your industry, your specific business model, and how you operate.
What really matters is understanding how your margin stacks up against others in your field and, even more importantly, how it changes over time.
Think of your gross profit margin less like a final grade and more like a vital sign for your business. It's the first and clearest indicator of how efficiently your core services are generating profit. When you track it consistently, that simple calculation becomes a powerful tool for making smarter decisions about your pricing, costs, and overall growth strategy.
Setting the Bar with Industry Benchmarks
One of the best ways to get some context for your number is to compare it against industry averages. This helps you figure out if your performance is healthy, exceptional, or maybe needs a bit of attention compared to your peers.
It makes sense that different service sectors in Australia have wildly different cost structures, which naturally leads to different margin expectations. For instance, a solo graphic designer with minimal direct costs will almost always have a much higher margin than a web development agency juggling contractor fees and project-specific software licences.
The goal isn't just to meet the average; it's to understand the "why" behind it. If your margin is lagging behind the benchmark, it could be a sign your pricing is too low or your direct costs are getting out of hand. On the flip side, a much higher margin might point to a strong competitive advantage or a premium position in the market.
Let's look at some typical ranges to give you a clearer picture of where your business might fit in.
Typical Gross Profit Margin Benchmarks by Service Industry (AU)
This table gives a snapshot of what you can generally expect across different Australian service-based industries. It’s not gospel, but it's a brilliant starting point to see how your own numbers measure up.
| Industry Sector | Average Gross Profit Margin Range | Key COGS Considerations |
|---|---|---|
| Creative Freelancers (Designers, Writers) | 75% - 95% | Primarily consists of project-specific software, stock assets, or minor third-party costs. Labour is the main input but often not formally costed for sole traders. |
| Digital Marketing & SEO Agencies | 30% - 50% | Heavily influenced by direct costs like contractor fees, ad spend pass-throughs, and specialised analytics tools for client campaigns. |
| IT & Management Consulting | 60% - 80% | The main cost is billable employee or contractor time. Margins are strong when utilisation rates are high and pricing reflects deep expertise. |
| Web Development & Software Agencies | 40% - 60% | Direct costs include developer salaries (billable portions), freelance specialists, server hosting for client projects, and software licences. |
Looking at these benchmarks, it's easy to see why a "one-size-fits-all" approach just doesn't work. A digital agency sitting on a 45% margin is likely doing quite well, but a freelance writer with that same margin would probably need to take a hard look at their pricing or project costs.
The Power of Tracking Your Margin Over Time
While industry benchmarks are great for a quick reality check, the real strategic gold is in tracking your own gross profit margin over time. Calculating it every month or quarter will reveal trends and patterns that a single, isolated number simply can't.
This consistent monitoring helps you:
- Spot Rising Costs Early: Is your margin slowly shrinking month after month? This is often the first warning sign that your direct costs, like contractor rates or software subscriptions, are creeping up and quietly eating into your profit.
- Make Smarter Pricing Decisions: If you see your margin is consistently high and stable, it can give you the confidence to nudge your prices up. If it's razor-thin, that’s a clear signal your current pricing isn't sustainable for the long haul.
- Assess Your Efficiency: A steady or increasing margin suggests you're getting better and more efficient at delivering your services. A dipping margin might mean projects are taking longer than quoted, causing your labour costs to blow out.
Ultimately, keeping a close eye on this metric gives you real control over your business's financial health. It’s a crucial part of managing your money effectively and, for a deeper dive into that, check out our guide on how to improve cash flow for your business. This simple habit transforms the gross profit margin from a backward-looking number into a forward-looking guide for your business strategy.
Common Calculation Mistakes to Avoid
Calculating your gross profit margin seems simple enough on the surface, but a few small slip-ups can give you a number that’s either misleadingly high or dangerously low. When you’re basing big decisions about pricing, hiring, and growth on this metric, getting it right isn't just about tidy bookkeeping; it’s fundamental to making sound business choices.
I’ve seen even seasoned business owners fall into a few common traps. By knowing what to look out for, you can make sure your calculation is a true reflection of your business's core profitability, not just a guess.

Let's break down the most frequent errors I see service businesses make and, more importantly, how you can sidestep them for a consistently accurate result.
Misclassifying Expenses
This is, without a doubt, the most common mistake. It happens when you muddle up a direct cost (Cost of Goods Sold) with an overhead or operating expense. The golden rule to remember is this: if a cost wouldn't exist without a specific client project, it’s COGS.
Here are a few classic misclassifications:
- Including office rent in COGS: Your rent is an overhead. You pay it every month whether you have one client or one hundred.
- Adding marketing costs: That Google Ads budget helps you find clients, but it's not a direct cost of delivering the service to them.
- Counting general software subscriptions: Your accounting software or CRM subscription is an operating expense. The exception? A special software licence you had to buy for one specific project. That’s a direct cost and belongs in COGS.
Getting this wrong can throw your margin way off. If you incorrectly pile overheads into your COGS, your gross profit margin will look much lower than it really is. This could trick you into thinking your pricing is unsustainable when it's actually perfectly healthy.
Forgetting to Exclude GST
For any Australian business, this is an absolute must. The Goods and Services Tax you collect on your invoices isn't your revenue. You're just holding onto it for the Australian Taxation Office (ATO).
If you calculate your margin using GST-inclusive figures, you're artificially inflating your total revenue. This makes your gross profit margin appear less healthy than it is. So, always use the ex-GST amount for your revenue when you run the numbers. A $5,500 invoice is $5,000 in revenue for this calculation.
Inaccurate Labour Cost Tracking
In a service business, time is literally money. The salaries and wages of the team members who deliver your service are your biggest direct cost. If you don't accurately track how much time they're spending on each client project, you're essentially guessing your largest expense.
This is a real blind spot for businesses with salaried employees, where it’s tempting to just see their pay as a fixed overhead. In reality, the portion of their time spent on billable client work is a direct cost that needs to be accounted for.
Failing to properly allocate labour costs to specific projects means you can't see which clients or services are truly profitable and which are barely breaking even. You might be losing money on a major client without even realising it.
The only way around this is precise time tracking. It lets you convert salaried hours into a direct project cost, giving you a crystal-clear view of your profitability on a per-project basis and ensuring your overall gross profit margin is built on solid data.
Common Questions About Gross Profit Margin
When you start digging into financial metrics like gross profit margin, a few questions always pop up. Let's tackle the most common ones so you can feel confident you're getting it right.
What's the Real Difference Between Gross and Net Profit Margin?
This is a big one. Think of it like this: gross profit margin tells you how much money you’re making from your core services before you pay your general business overheads. It only looks at your revenue versus the direct costs (COGS) involved in delivering that work.
Net profit margin, on the other hand, is your bottom line. It’s what's left after every single expense (rent, marketing, software subscriptions, admin salaries, taxes) has been paid.
So, gross margin shows the profitability and efficiency of your actual service delivery. Net margin shows the profitability of the entire business.
How Often Should I Be Calculating This?
For any service business, keeping a regular pulse on your numbers is key. I’d recommend calculating your gross profit margin monthly or quarterly.
This rhythm is frequent enough to spot trends before they become problems. You can see if your costs are creeping up on a specific type of project or if a new pricing structure is actually working. Waiting a whole year is too long; you could be losing money for months without realising it.
At the absolute minimum, run the numbers as part of your annual financial review.
A negative gross profit margin is a serious red flag. It means you're spending more to deliver your service than you're earning from it. This signals an urgent need to either raise your prices or slash your direct costs, or both.
Do Salaries Get Included in the Gross Profit Margin Calculation?
This is where many people get tripped up. The answer is, "it depends on whose salary."
Here’s how to think about it:
- Direct Labour (Included): If a team member is directly involved in delivering the client's work (like a designer, a consultant, or a developer) their wages for that project time are a direct cost. That portion of their salary belongs in your COGS.
- Overhead Roles (Not Included): Salaries for people in support roles like administration, sales, or management are considered operating expenses, not direct costs. These are factored into your net profit, not your gross profit.
Tired of wrestling with spreadsheets to figure all this out? Payly brings your time tracking, invoicing, and cost management together, so you can see your gross profit margin in real-time. Start your free 14-day trial today and get the clarity you need.
Payly Team
Sharing insights and strategies to help service businesses thrive. Follow Payly for more tips on time tracking, invoicing, and business operations.
Related Articles


Ready to streamline your business?
Join thousands of freelancers and agencies who use Payly to track time, send invoices, and get paid faster.